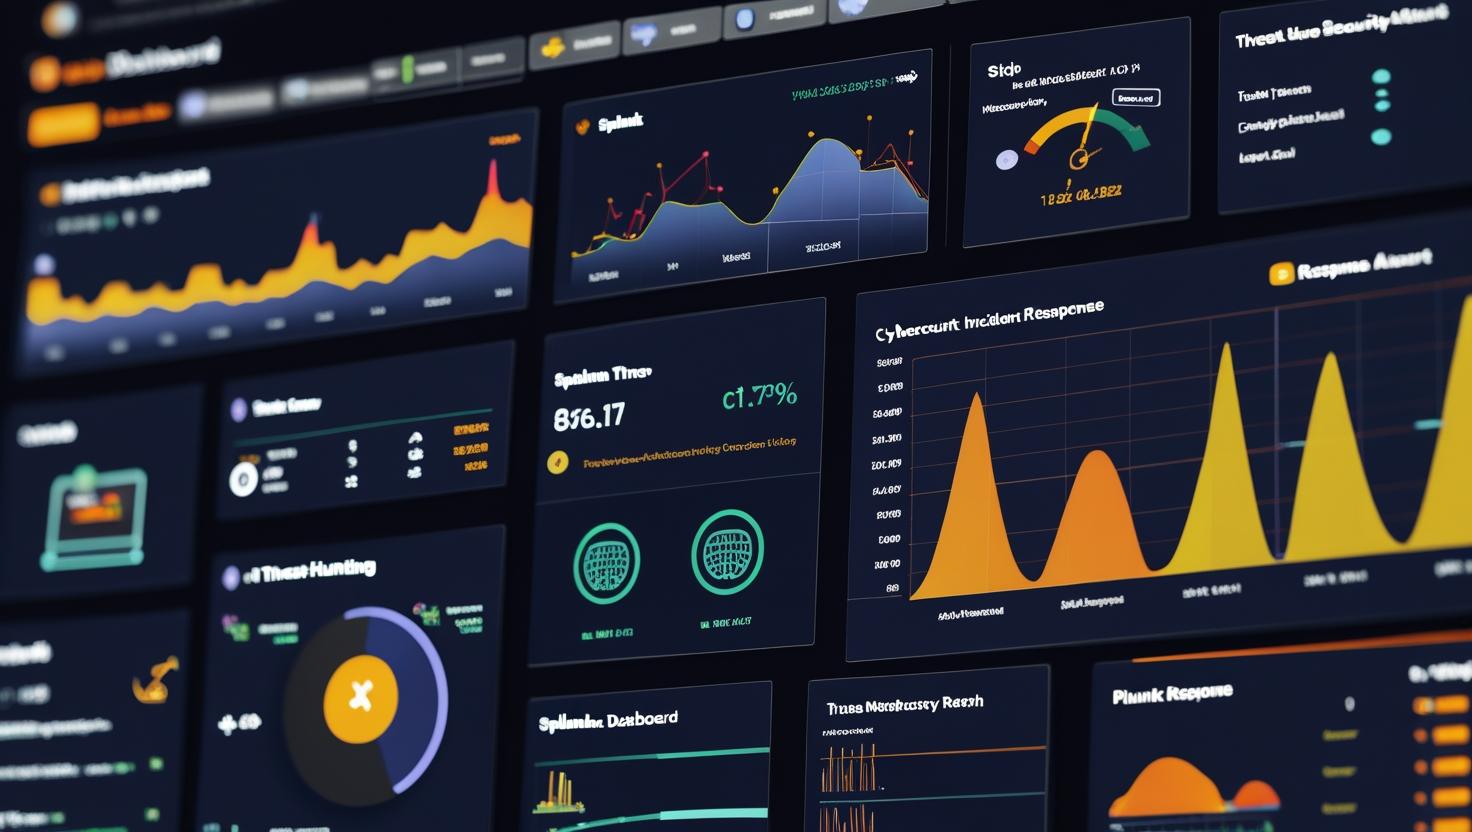
Splunk DFIR Dashboard Collection
Digital Forensics and Incident Response (DFIR) professionals know that speed and efficiency are critical during investigations. The Splunk DFIR Dashboard Collection is a treasure trove of ready-to-use Splunk dashboards designed to streamline forensic analysis and provide immediate insights into collected log data.
https://github.com/dfirvault/Splunk-DFIR-Dashboards
🔍 What’s Inside?
This GitHub repository contains a curated set of tested, production-ready Splunk dashboard XML files built specifically for DFIR investigations. These dashboards were developed and refined over years of real-world incident response cases, ensuring they meet the needs of analysts dealing with:
Windows Event Logs (EVTX)
Plaso timelines
CSV/JSON logs from EDRs & triage tools
Other forensic artifacts


✅ Key Features
✔ Case-Based Dropdown Selector – Quickly switch between different investigation indexes.
✔ Plug-and-Play Functionality – Just ingest logs into a designated index, and the dashboards auto-parse them.
✔ Automated Analysis – Pre-built searches and visualizations highlight key forensic artifacts.
✔ Flexible Data Support – Works with EVTX, CSV, JSON, NDJSON, and more.
✔ Optimized for Splunk Enterprise – No Splunk Cloud dependencies.
🚀 How to Use These Dashboards
1️⃣ Install Splunk Enterprise
If you don’t already have Splunk running, download and install it from:
🔗 https://www.splunk.com
2️⃣ Ingest Your Forensic Data
Use Splunk’s “Add Data” interface or CLI to load logs into a case-specific index (e.g.,
case_july2025_ransomware).
3️⃣ Import the Dashboards
Option A: Copy/paste the XML into Splunk’s “Import Dashboard” feature.
Option B: Manually place the
.xmlfiles into:$SPLUNK_HOME/etc/apps/YOUR_APP_NAME/default/data/ui/views/
4️⃣ Start Analyzing!
Open the dashboard, select your case index, and explore:
Event Log Triage
Process Timelines
Logon Activity
Detection Hits by Rule
Plaso Timeline Analysis
🛠 Dashboard Types Available
| Dashboard | Purpose |
|---|---|
| 🖥️ DFIR Linux Security Event Overview | Linux Security Event Analysis |
| 💾 DFIR Plaso Dashboard | Parse and visualize Plaso timelines |
| 🛡️ DFIR Windows Security Event Overview | Windows Security Event Analysis |
📚 Additional Resources
Splunk Documentation – For setup and customization.
- https://github.com/Truvis/SplunkDashboards/tree/master
🤝 Contributions & Feedback Welcome!
This project is community-driven. If you:
Have enhancement ideas
Spot bugs or false positives
Want to contribute your own dashboards
👉 Open an Issue or Submit a Pull Request!
Why This Repository Matters
DFIR analysts often spend hours building custom dashboards for each case. This collection eliminates that overhead, allowing responders to focus on analysis rather than setup. Whether you’re investigating ransomware, insider threats, or malware outbreaks, these dashboards provide immediate visibility into critical forensic data.
🔗 Check out the repo here: GitHub – Splunk DFIR Dashboard Collection

